Is Your Marketing Actually Working?
Your marketing person says traffic is up. Ads are running. Website looks good.
But bookings haven't changed in 6 months.
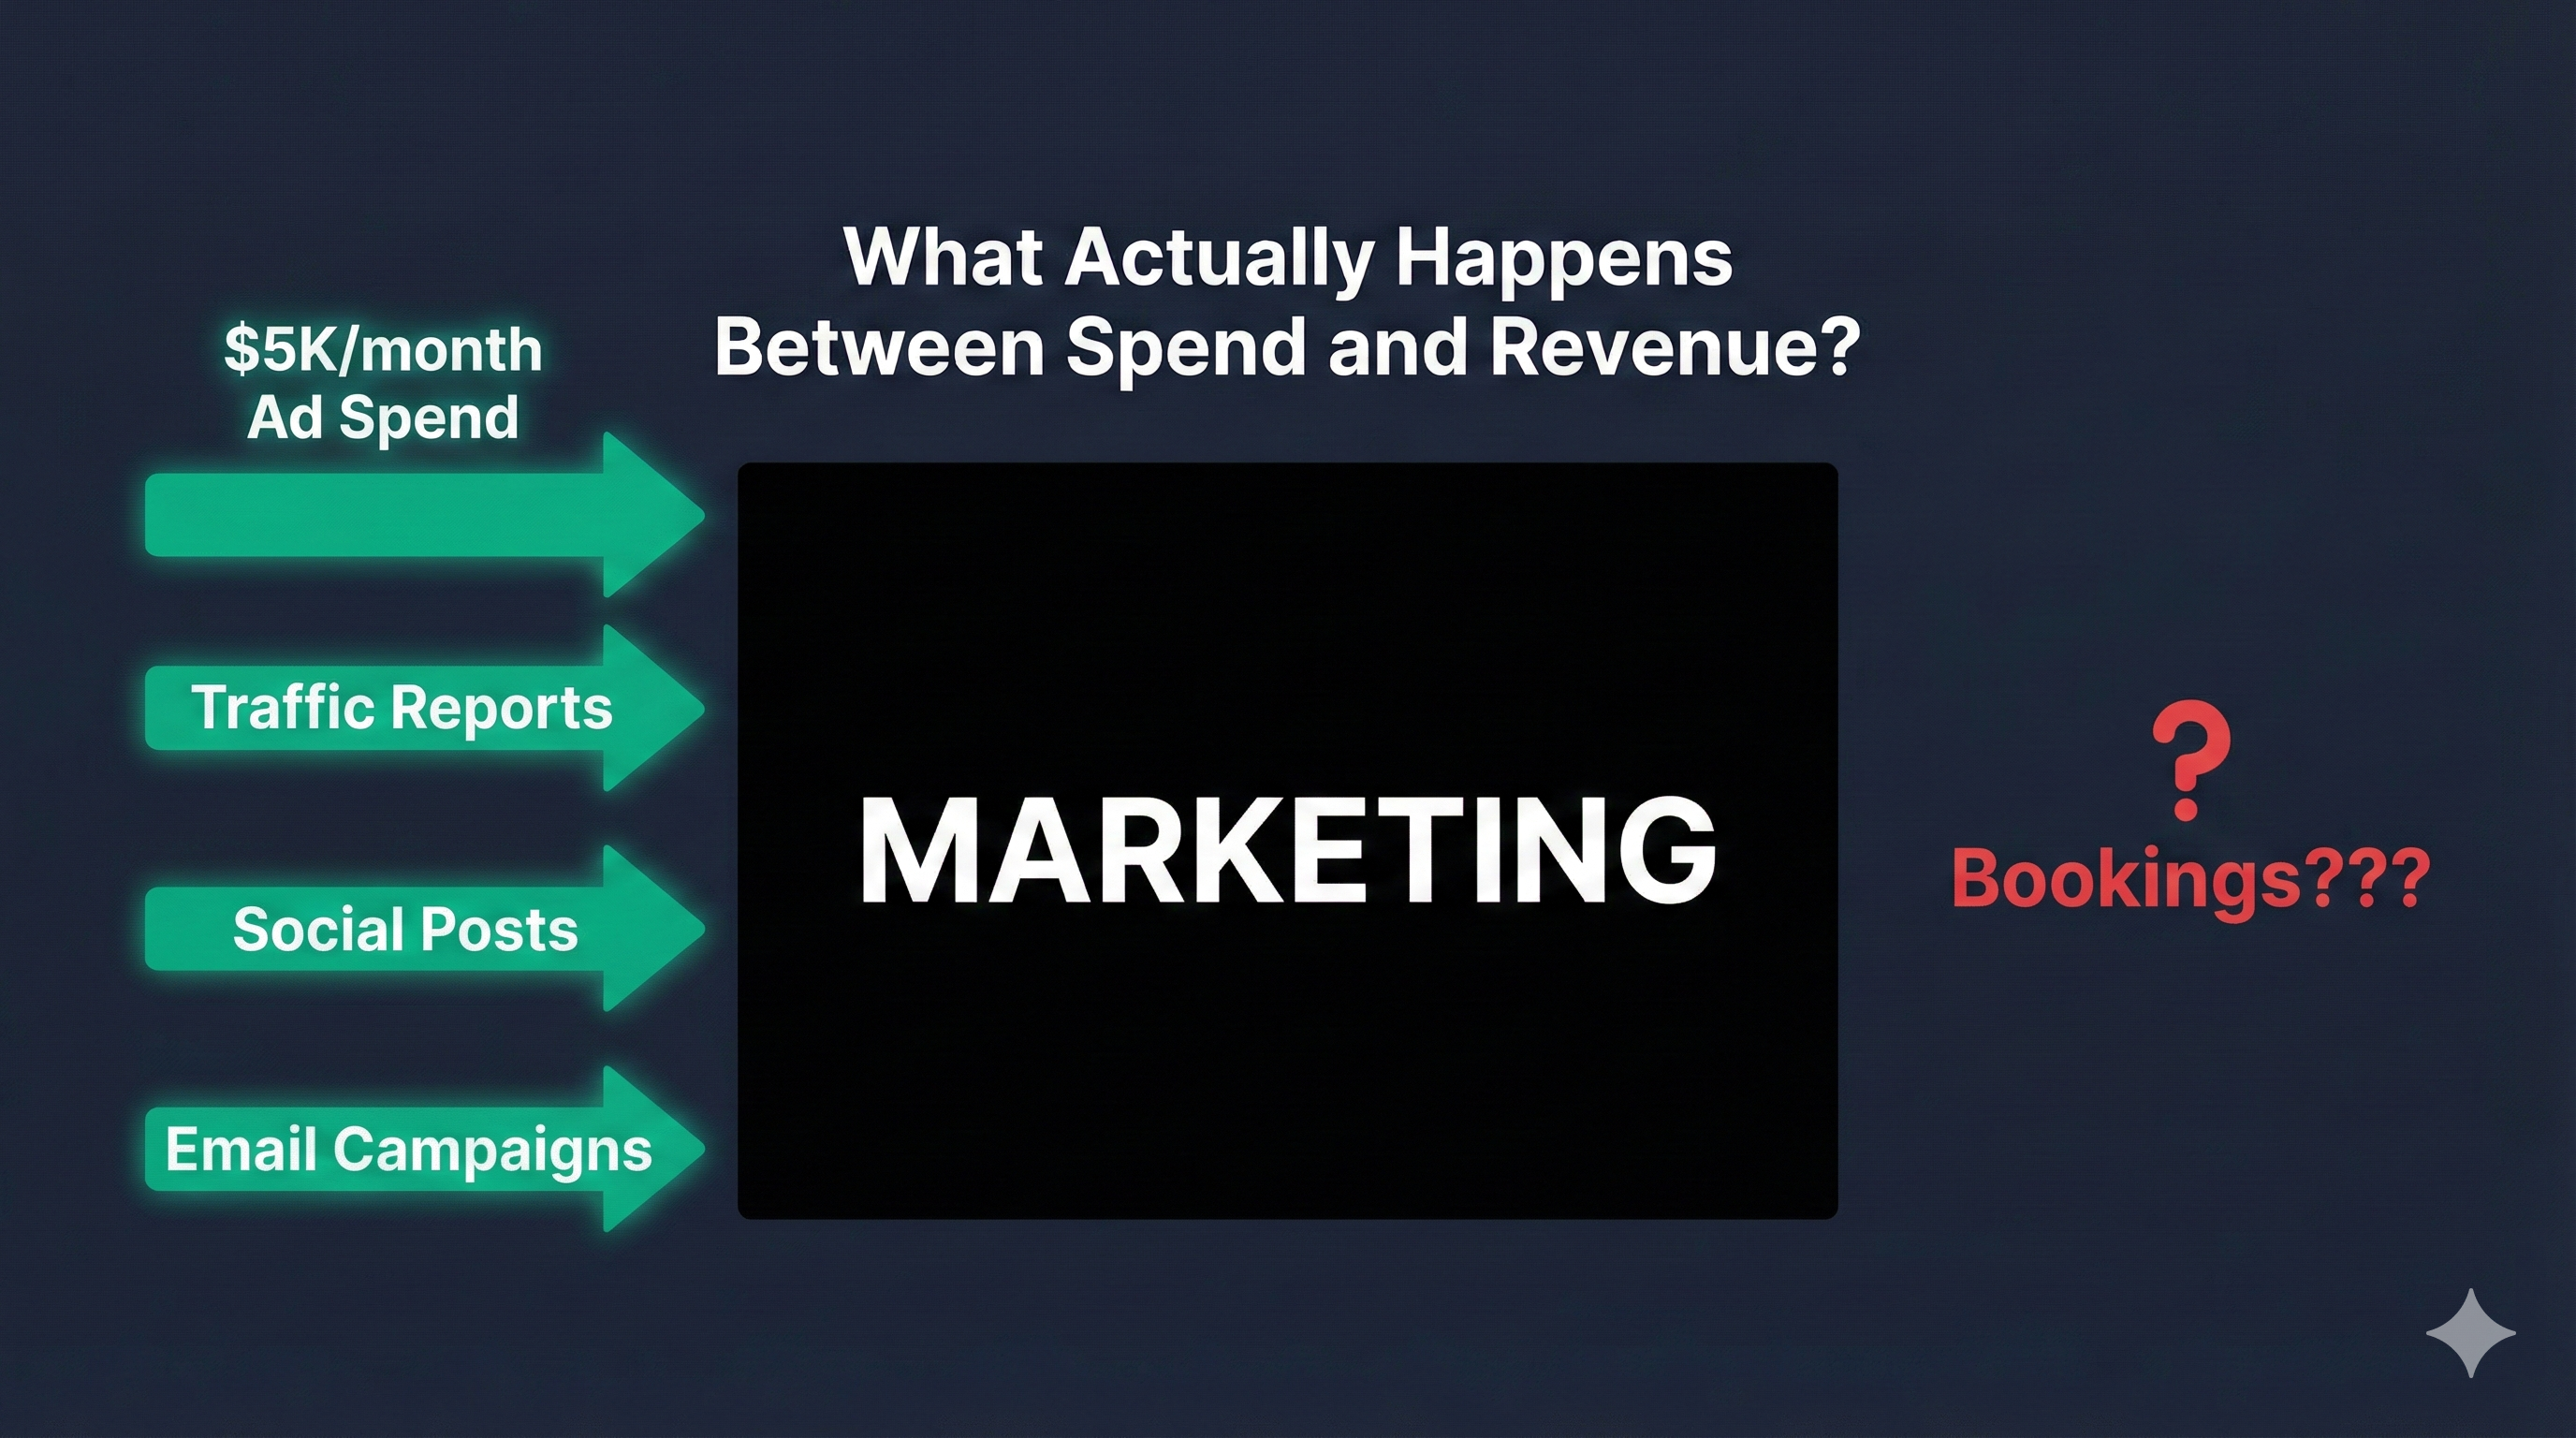
The Black Box Problem: Most service business owners spend $3K-$10K monthly on marketing with zero independent validation it's converting into revenue. Marketing talks clicks and impressions. Nobody connects those to actual bookings.
If this sounds familiar, you're not alone. And more importantly—this isn't about firing your marketing person.
Your nephew who "knows websites," the local agency, the freelancer managing ads—they're probably competent at execution. The problem: Getting traffic requires one skill set. Converting that traffic into revenue requires a completely different one.
This guide shows you how to diagnose whether your marketing actually works—without being a marketing expert.
Why Service Businesses Get Stuck at $250K-$3M
Predictable pattern with service businesses in this range:
- •Moved past DIY marketing
- •Hired someone to handle it (agency, freelancer, relative)
- •Traffic numbers look good on paper
- •But growth has plateaued
What's actually happening: Nobody systematically connects website performance to actual bookings.
The "It Looks Professional" Trap
Most owners judge websites like storefronts: Professional? Modern design? But conversion rate has almost nothing to do with "professional" appearance. A beautiful site converting at 2% leaves $50K+ on the table vs an average site converting at 8%.
You're not stuck because your marketing person is incompetent. You're stuck because you're past general marketing knowledge—but before you can afford a full CMO who understands conversion optimization.
What They Track vs. What Actually Matters
The disconnect in most service businesses:
What They Track
- • Website traffic (vanity)
- • Social followers (vanity)
- • Email open rates (vanity)
- • "Professional design" (subjective)
What You Should Track
- • Visitor-to-lead conversion rate
- • Lead-to-booking conversion
- • Cost per acquired customer
- • Revenue per marketing dollar
The gap between these lists is where your profit leaks.
When "How's our marketing doing?" gets "Traffic is up 30%!"—that's not an answer. The real question: "Did we get 30% more bookings?" If not, traffic increase is worthless.
The 5 Conversion Leaks Hiding in Plain Sight
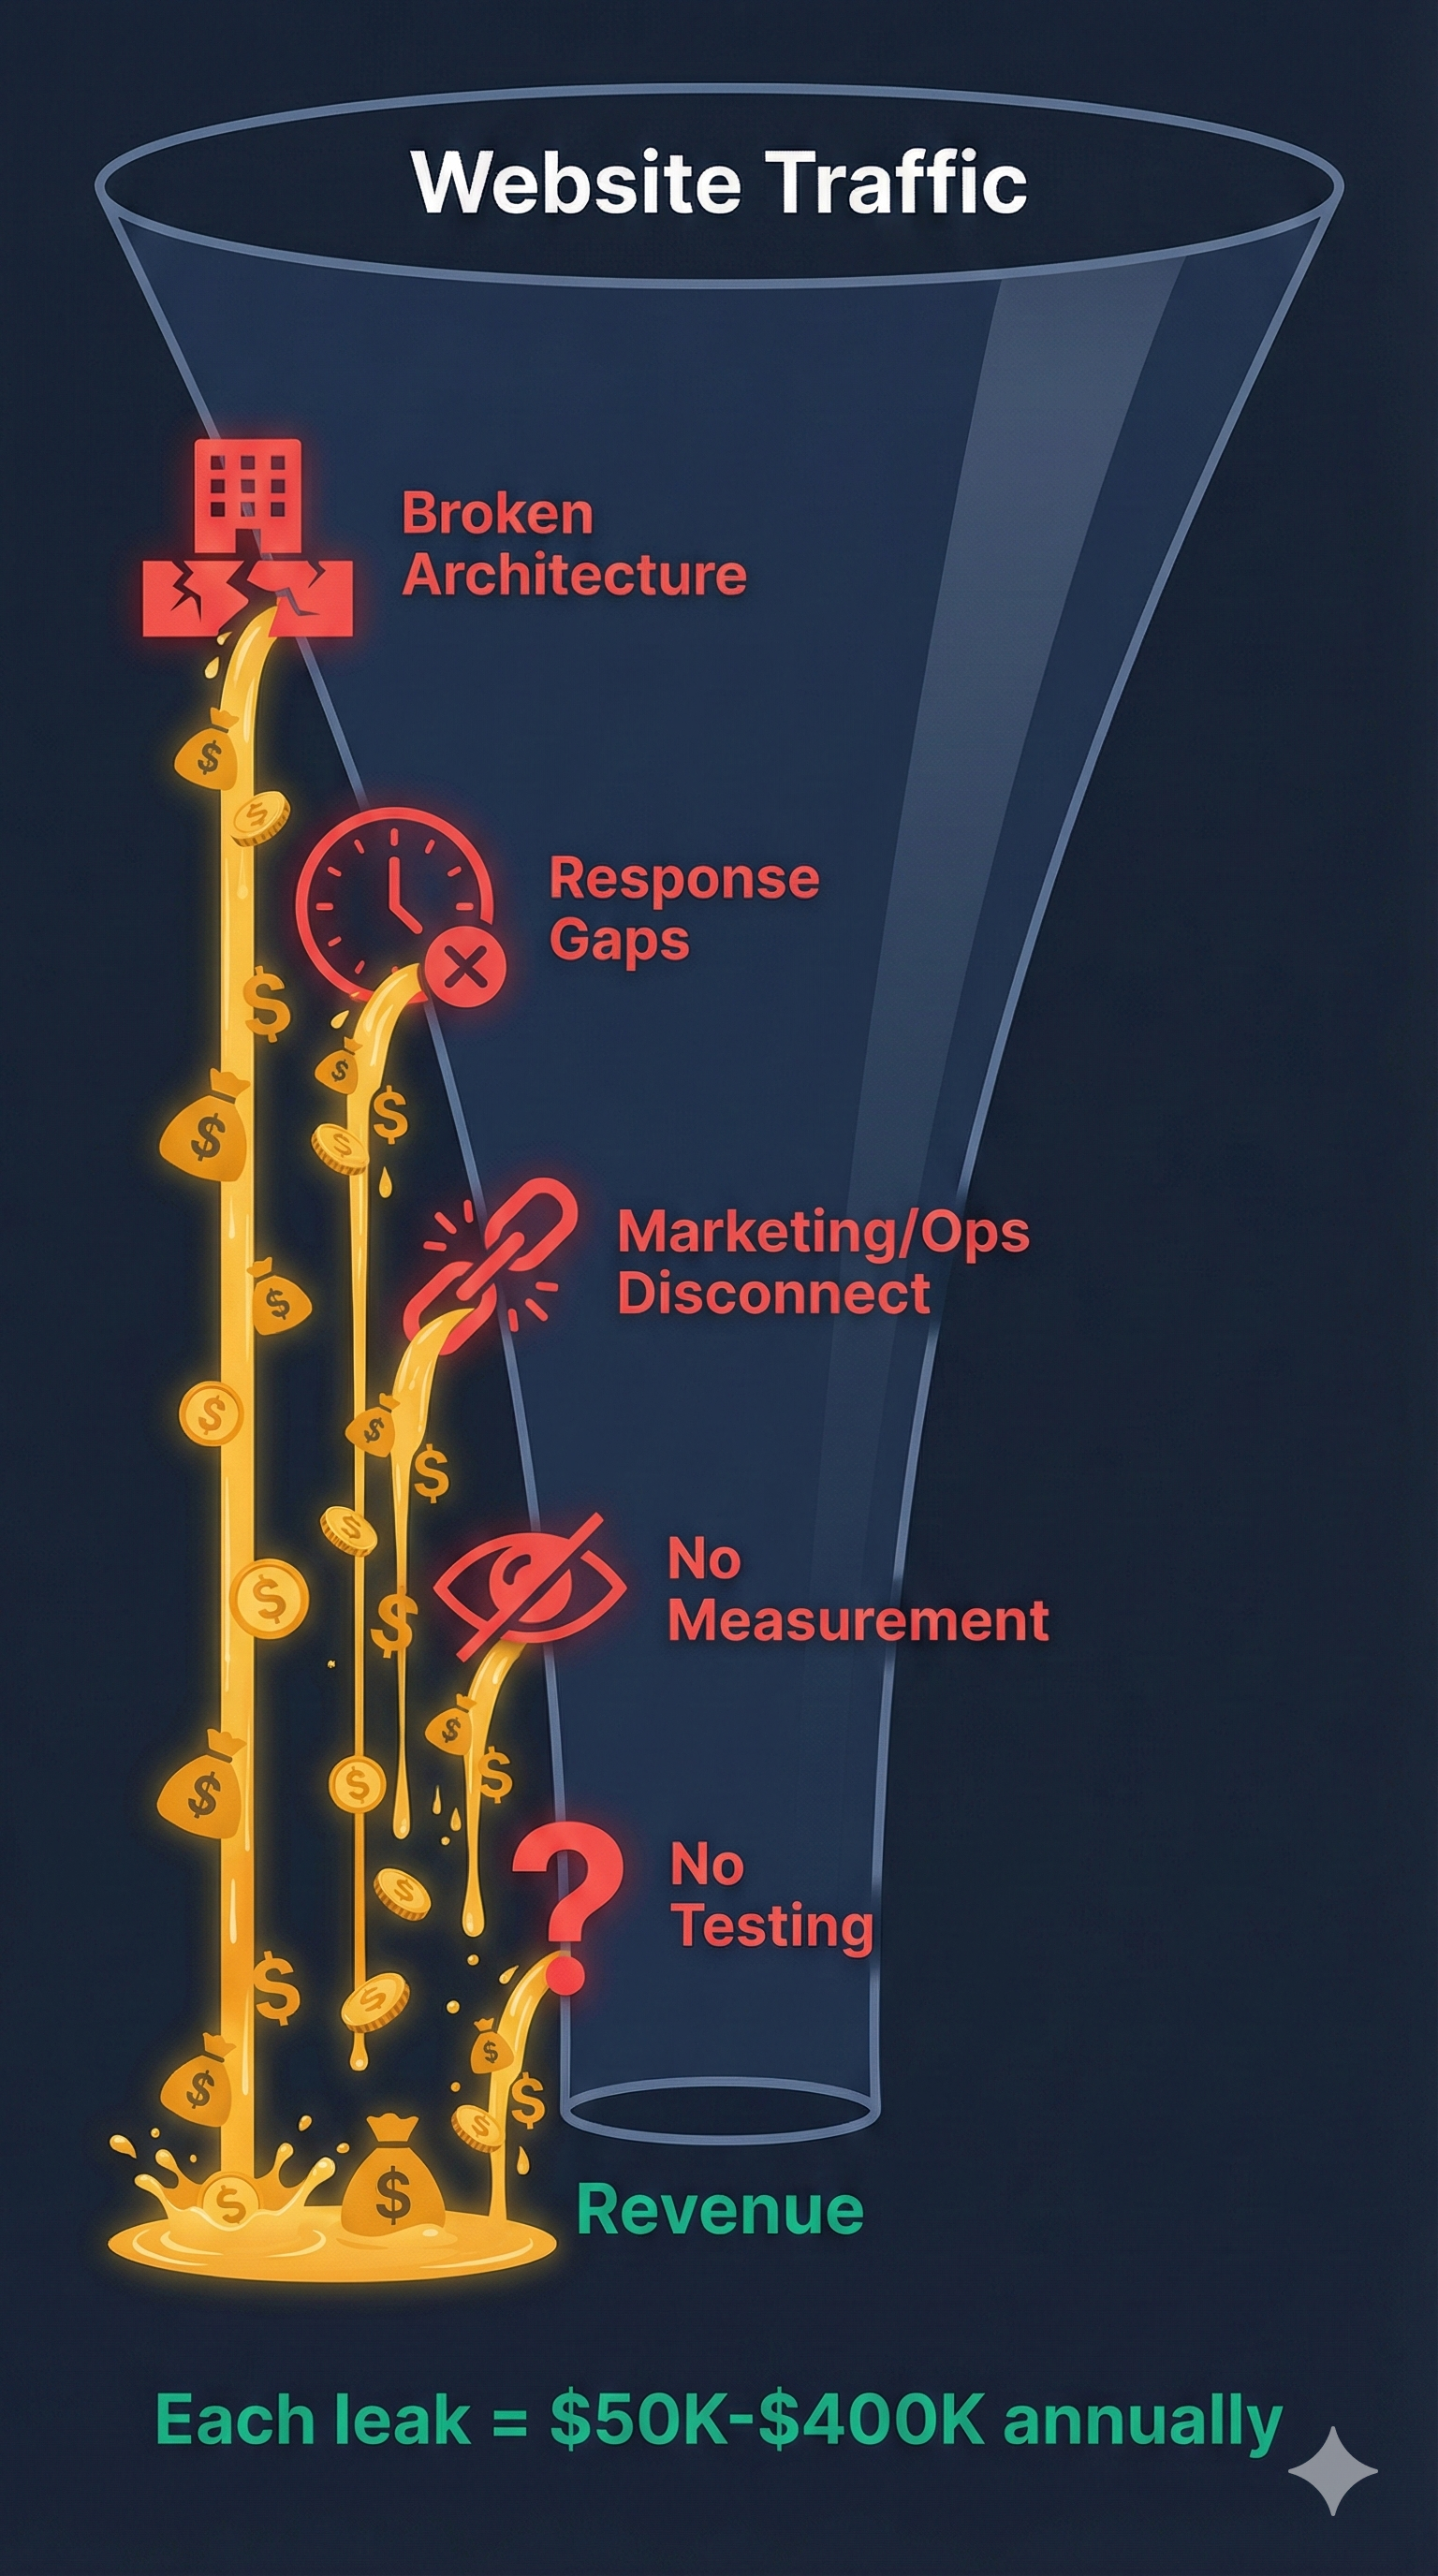
After analyzing hundreds of service business websites, the same conversion leaks appear repeatedly. Most marketing people miss them because they focus on tactics (running ads, posting content) rather than strategy (does this actually convert?).
Leak #1: Broken Conversion Architecture
The Problem: Your website asks for a booking before earning trust.
Why It Happens: Developers build sites that look good. Designers focus on aesthetics. Nobody thinks about the psychology of conversion.
Real Example: Psychiatric urgent care practice with 63% high-intent traffic (organic + direct searches). Converting at 5.2%—generating 94 bookings monthly. Previous agency said site looked great, told them to keep running ads.
A conversion audit revealed:
- • Homepage asked for booking immediately (before building trust)
- • Three competing CTAs confusing visitors
- • Social proof buried below the fold
- • No clear differentiation from competitors
The Cost: At their traffic level, properly structured sites convert at 8-10%. They were leaving $400K per year in potential bookings on the table.
The Fix: Trust-building elements first, CTA second. Single primary call-to-action. Social proof visible immediately. Clear service differentiation.
Leak #2: Lead Response Gaps
The Problem: Manual intake, overloaded front desk, 4+ hour response times.
The Reality: 80% of leads never convert due to poor follow-up. Your marketing is working—operations can't keep up.
Why It Happens: Marketing people focus on generating leads, not what happens after conversion. No system connecting marketing to operations.
The Cost: Spending $5K/month on ads with 80% of leads not followed up properly = effectively wasting $4K/month.
Warning Signs:
- • Form submissions going to shared email inbox
- • Front desk manually calling leads back when they have time
- • No automated confirmation after form submission
- • No tracking of which leads were contacted and when
Leak #3: Marketing-to-Operations Disconnect
The Problem: Marketing drives volume your operations team can't handle.
Why It Happens: Marketing and operations never talk. Marketing measures success by lead volume. Operations measures success by customer satisfaction. These goals conflict when lead quality suffers.
Example Scenario:
- • Marketing runs aggressive ads during peak season
- • Response times slip from 1 hour to 6 hours
- • Lead quality drops (desperation clicks, not qualified buyers)
- • Operations team gets frustrated, conversion rate tanks
Leak #4: Unmeasured Conversion Funnel
The Problem: Nobody knows where leads actually drop off.
What's Usually Missing:
- • Conversion events not set up (form submissions, calls, bookings)
- • No tracking of conversion rate by traffic source
- • No visibility into which pages convert vs don't
- • No heatmaps showing where people click (or don't)
The Cost: Marketing decisions based on guesses rather than data. Repeatedly investing in wrong areas.
Leak #5: No Systematic Testing
The Problem: Marketing decisions based on "looks good to me" rather than actual testing.
Why It Happens: A/B testing requires technical sophistication most marketing people don't have. Easier to make subjective decisions and hope they work.
The Reality: Small conversion improvements (moving from 4% to 5%) flow directly to the bottom line. A 1% conversion improvement on a site getting 1,000 monthly visitors = 10 additional leads per month = $50K-$100K additional annual revenue for most service businesses.
Real Case Study: Psychiatric Urgent Care
The Setup
Their Situation
- • Beautiful website built by reputable local agency
- • Strong traffic (63% high-intent: organic + direct searches)
- • Owner had zero visibility into conversion performance
- • Agency said "looks great, keep running ads"
What the Audit Revealed
- Homepage Structure: Asked for booking before building trust
- CTA Confusion: Three competing calls-to-action
- Buried Proof: Social proof and credentials below the fold
- No Differentiation: Looked like every other urgent care site
- Mobile Broken: Key forms didn't work properly on phones
Projected Outcome (60 days post-implementation)
Same traffic. Same team. Just better conversion strategy.
How to Audit Your Marketing Without Being an Expert
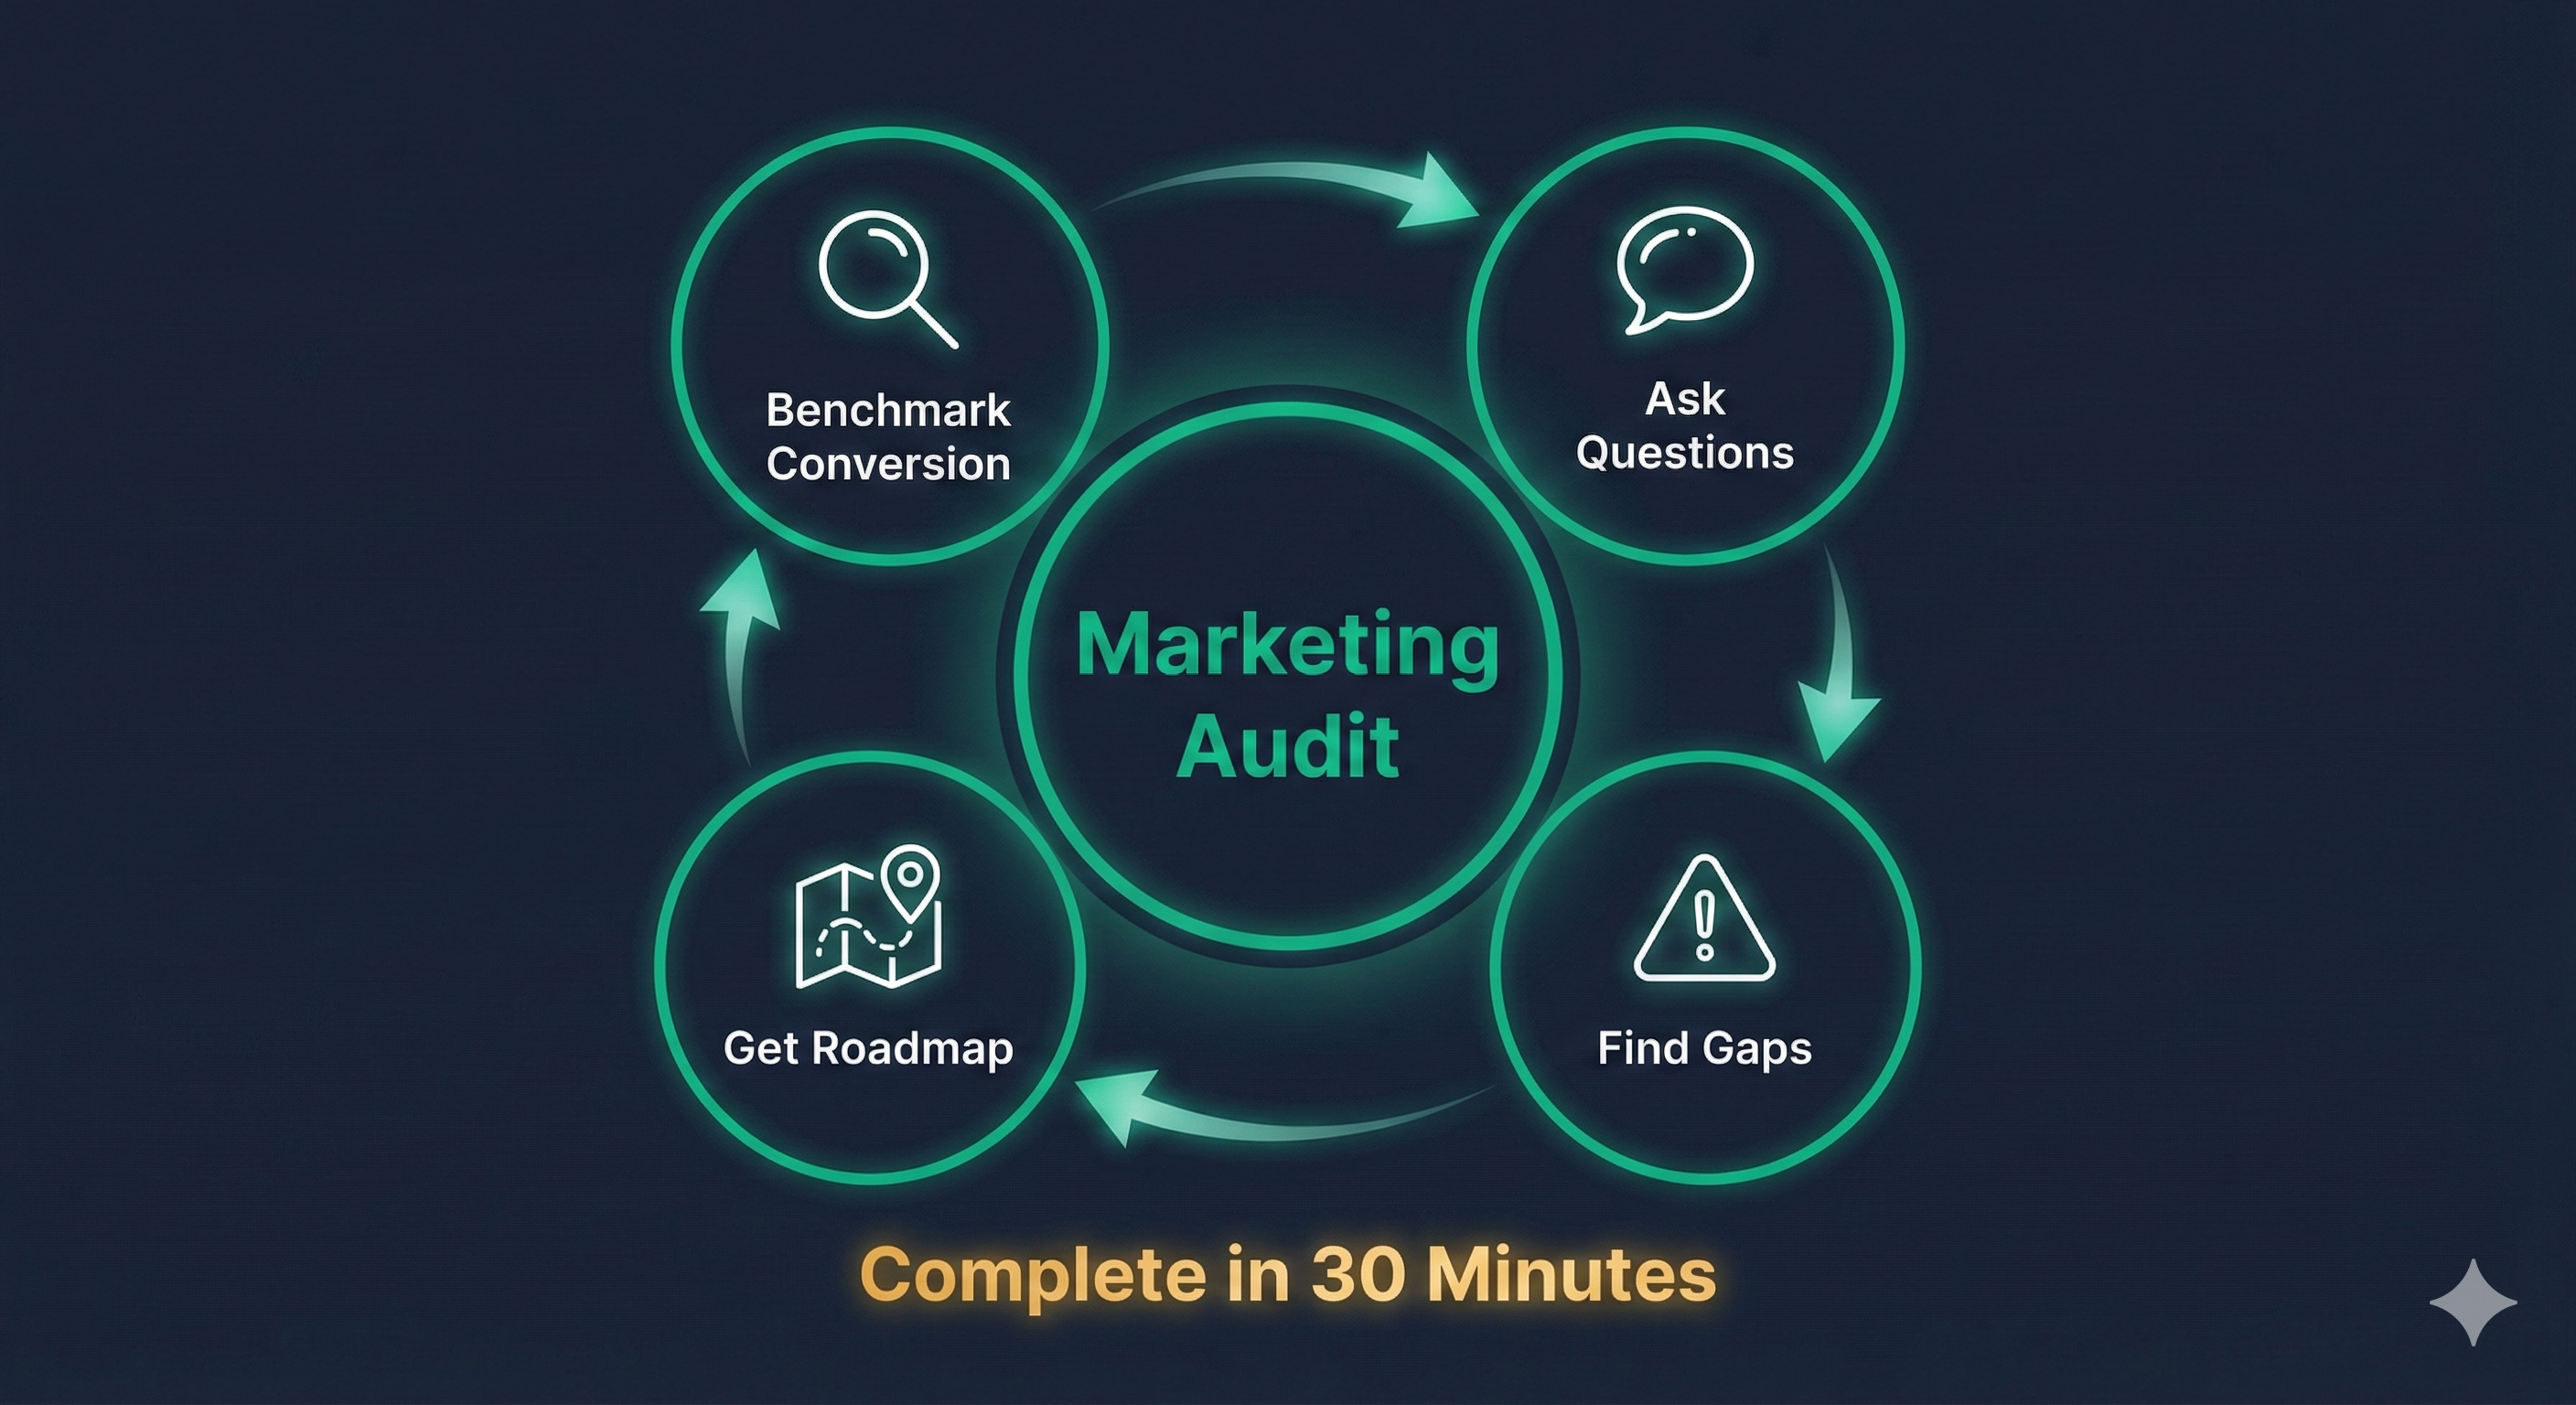
You don't need a marketing degree to know if your marketing is working. Just ask the right questions and look at the right numbers.
Step 1: Benchmark Your Conversion Rate
Formula: (Leads / Website Visitors) × 100
Industry Benchmarks (2025):
- Healthcare/Dental: 2-4% average, 8-10% top performers
- Professional Services (B2B): 2.9% average, 6-8% top performers
- Home Services: 3-6% average, 8-12% top performers
If you're below 5%, you have a conversion problem—not a traffic problem. Spending more on ads will just waste more money. Fix conversion first, then scale traffic.
Step 2: Questions Your Marketing Person Should Answer Instantly
1. "What's our current visitor-to-lead conversion rate?"
Good answer: Specific percentage with trend direction
Red flag: "I'd have to check" or "Traffic is up!"2. "How does that compare to industry benchmarks?"
Good answer: References specific data, acknowledges gaps
Red flag: "Every business is different"3. "What are we actively testing this month?"
Good answer: Specific A/B tests with hypothesis
Red flag: "We're monitoring performance"4. "Can you show me which pages convert best and worst?"
Good answer: Pulls up GA4 report immediately
Red flag: "Let me get back to you"
Ready to Find Your Hidden Revenue?
Get a complete conversion audit of your website with prioritized fixes and projected revenue impact.